Why Marketing Reports Should Never Live Alone
Bring your other business analytics alongside marketing.
 Read time: 3.5 min
We’re Used to Seeing Marketing Analytics
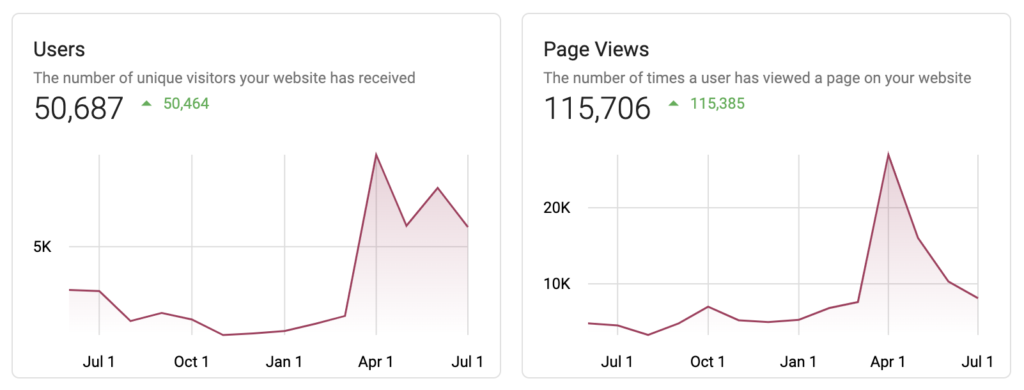
We’ve all seen, in some capacity, a Google analytics report showing your website visitor totals, bounce rate (probably confused you), and the most popular devices people use to visit your site. Yet, most business owners are not used to seeing the full scope of their businesses visualized in this way. The fancy visuals are reserved for Facebook Ads, Google Ads, Google Analytics, and all the standard services from the digital marketing toolbox. These reports are great. Data is great. But they’re only one slice of your business pie.
The Marketing Agency Dilemma
Many companies work with a marketing agency, marketing contractor, or digital software that is meant to drive more people to spend more money with your business. I’ve been in the digital marketing service business with Eighty6 for many years. We’ve provided countless reports to our clients, tracked an incredible amount of conversions, and exported more PDFs than we can count. No matter what the reports say, there is always more to the customer’s story.
As a marketer, let’s say you have a client that you’re crushing it for. The numbers are through the roof. By all accounts, things are going well. It surfaces later that financially, the business is not doing as well as your reports on the marketing side might suggest. You’re perplexed and not understanding how things could have gone so wrong. The answer lies in your business analytics as a whole.
A “Conversion” Sounds Better Than It Is
You’ll always hear marketers talking about conversions. I do it all the time. It’s your value currency to your customer as a marketer. It verifies your efforts. But unless you’re selling something directly on your website that involves a shopping cart and a credit card, conversions can stray far from the real picture of your business health. Here’s a basic example: Let’s say there is a conversion setup that tracks form submissions on your contact page on your website. Your marketer is running some Google Ads encouraging people to submit on that form. Ideally, you’ll start your ad setup process with a sales conversion rate. An easy way to do that is to track out of every 10 form submissions how many convert to sales. For this example, let’s say 3 out of 10, or a 30% conversion rate. Combine that with the average value of a transaction, let’s say $1,000, and you’ll have your building blocks to begin calculating another favorite term of marketing: ROI, or return on investment.
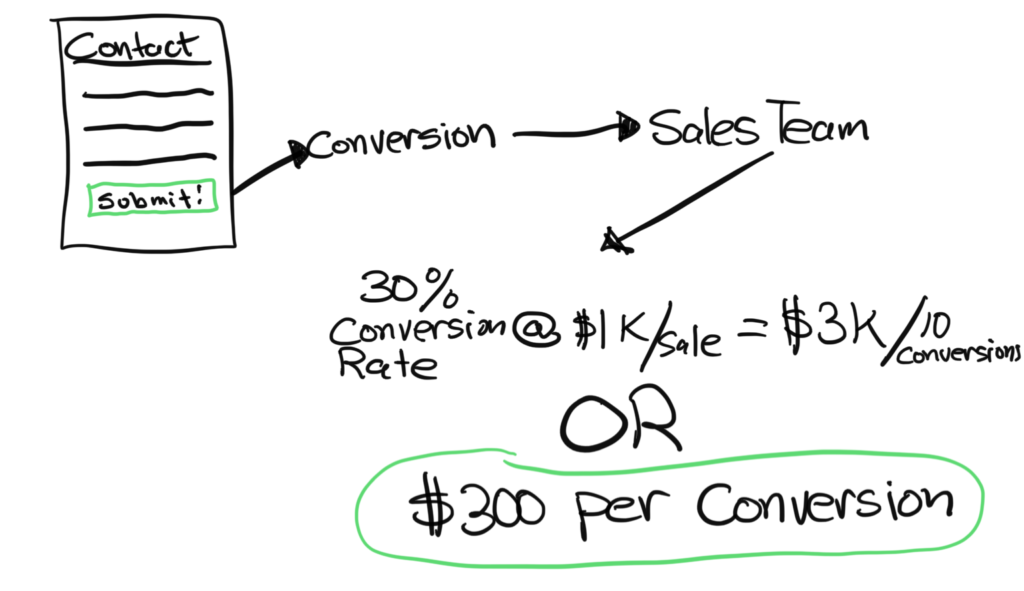
In theory, every time you get a form submission, you make $300. If you spend $5,000/month on ads and that generates more than 17 form submissions on your contact page, you’re making money. Easy, except I’d argue there are almost infinite factors that go against this being an exact science. What if the potential customer clicked on your live chat instead? Or decided to find you on LinkedIn and message you there? Or, they Googled you a week later after they saw the ad and reached out then?
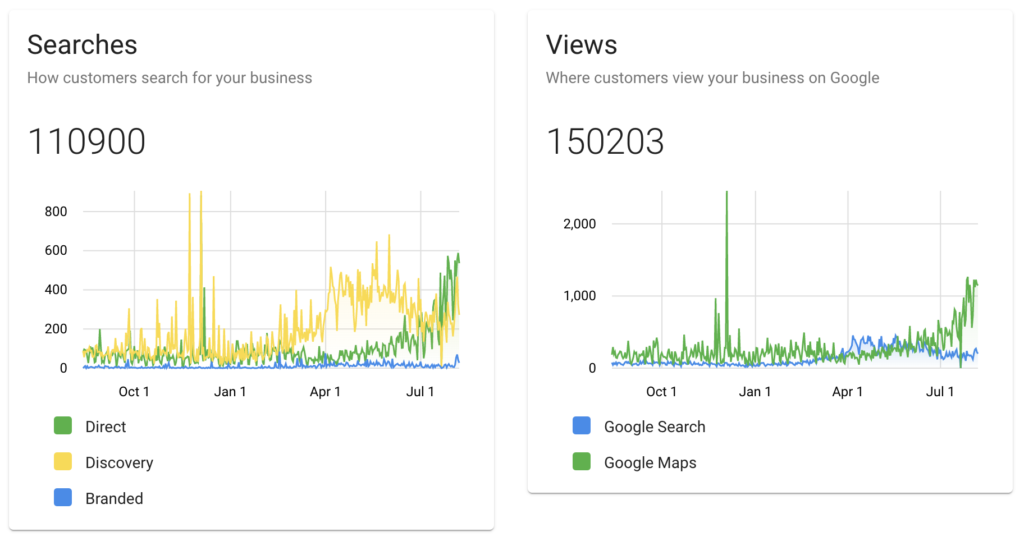
In the end you get a report from your marketing agency or contractor specifying how the Google Ad campaign did based on the form submissions. You decide to fire them because there were not enough submissions on the contact form or because revenue didn’t match up to the ROI calculation. But what if you were able to see that your revenue increased alongside this marketing data found in the report? What if your website was down for extended periods of time and you didn’t know, and customers reached out another way? What if a good salesperson left the company during this time, and leads were not handled correctly? What about all the visibility you received on Google Maps with the ads running that are now gone? My point is that there are multiple things to assess as a whole when looking at your business. Your data needs to be brought together.
Bring All Your Data Together Into a Single Dashboard
At Pulse, we’re making this a reality by creating customized dashboards that give business owners and managers access to key information at all times. We’re bringing in data from all your business applications, agencies and contractors, into one place. So you have a single point of truth for your business. See the health of your business at a glance, or dive deeper into the data you care about. We don’t believe in being robots, but we do believe you should be making decisions with the knowledge your business data provides when you can view it together.

Using Your Dormant Data to Save Time & Make Decisions
Read time: 6.5 min
What to do with all this data?
The first thing to come to mind for a small business owner when hearing the word analytics is often “Google Analytics” – the tool that’s used to understand what’s going on with your website. But analytics in your business should encompass a much broader scope of information than just that. Every piece of software you use is producing data – and the problem starts there.
Small businesses typically require multiple pieces of software that each specialize in a specific topic. Your salespeople may use Salesforce.com, Pipedrive, or Copper as your CRM. Maybe your marketing agency uses Google Analytics to report on your website. Your CFO uses Quickbooks or Xero for accounting. And you’re producing work using Asana or Trello. Those tools all do a great job in their respective roles, but how can you see key data from each one, all together, in a single location?
We at Pulse by Eighty6 have the solution. We create custom dashboards so you can get in, see what you want to see, and get out. We give you your time back by giving you the information you need and can actually use to make decisions.
Unify your analytics.
If you’re even utilizing the reports currently living in each piece of software you use, you’re probably viewing them each individually – and you’re probably getting more data than you can comprehend. That overwhelming, siloed approach doesn’t work when you’re trying to understand your business as a whole entity. Instead, you want to bring the data analytics from all of your software into one single location, creating a single source of truth that you can access anytime, from anywhere, without multiple logins or waiting on a PDF. When you bring this information together, you’re able to see what you want when you want, ultimately saving you time.
Define what’s important to you.
Maybe you’ve accepted that the only analytics you’re going to get is what comes standard with each software platform you use. But the truth is that as a business leader, you will have KPIs (key performance indicators) that are important to your own unique business, and there’s nothing standard about that. Your unique KPIs are what drive the business forward. When you centralize your analytics into a single location, you’ll see everything you want to see and may even spot some new indicators that you’d never considered before. Imagine layering your financial data for the year on top of your website conversions, seamlessly, to spot trends. Or seeing potential deals from your CRM next to your marketing initiatives. It’s all possible.
Put it on a big screen or keep it private.
For those at-a-glance, company-wide metrics that your team is rallying around, a TV is a great place to view your small business analytics. These are the numbers that drive the business. Information you don’t mind your employees viewing regularly. It’s empowering to have your business intelligence on display. In most business owners’ offices I enter, when they have a TV on the wall, it’s typically filled with security cameras. What if that display also had real-time business analytics? Your decisions and thoughts will be more informed as you meet with your team throughout the day, and you don’t have to dig around your computer to get the information.
For your sensitive information, including financials or anything else you wouldn’t want people to see, you can password-protect your visualizations and view them privately on your personal devices, such as a smartphone, tablet, or laptop – anytime and anywhere. Our visualizations scale up to fit large screen TVs and down to mobile-friendly sizes. While most people are picking up their phones in the morning and viewing Facebook, you can click to get an instant health check on your business as you prepare for your day. The ability to view this info anytime saves you time. It also saves employees’ time, and it puts you in control.
We set out to save customers’ time and help you make decisions based on data, not opinions.
My background is in direct marketing, and for the past nine years, I’ve been heading up www.Eighty6.agency working with small businesses to market themselves. I found that all – yes, all – of the customers that we were providing marketing services for were never truly seeing the big picture of their company analytics. We’d prepare these great reports each week and each month, but the information would remain siloed away from other critical business data. The most feedback we’d get from our customers was being told if they were doing well financially or not doing well financially.
Our reporting on marketing was interesting to them, but if revenue was not matching it, those numbers didn’t matter. It left us in a strange position. We’re hired as your marketing experts and we know we’re supposed to deliver people to your business; but past that, we had no idea about any gaps in the business process. It was a problem. Pulse by Eighty6 was created to save customers’ time and give you a complete picture of your business using data, not opinions.